

Alpha Trend Indicator Explained
The Alpha Trend indicator is a powerful tool that can help you identify trends and trading points. By interpreting trends in a more relevant way, you can make more informed trading decisions.
In this blog post, we’ll dive into the working principle of Alpha Trend and show you how to use it to create a winning strategy. Plus, we’ll share tips on how to incorporate Alpha Trend into Traderlands, so you can take your trading to the next level.
What is an Alpha Trend Indicator?
The Alpha Trend indicator is a powerful tool that traders use to identify trends and trading points in the market. It addresses four key elements:
- Reducing false signals at sideway market by trading less frequently
- Creating a meaningful trading system by combining indicators from different categories
- Establishing reliable buy and sell points
- Identifying potential support and resistance levels
Despite its advanced capabilities, the Alpha Trend indicator is easy to use and understand. It’s a great option for both beginners and experienced traders looking to improve their crypto analysis.
How to use Alpha Trend Indicator?
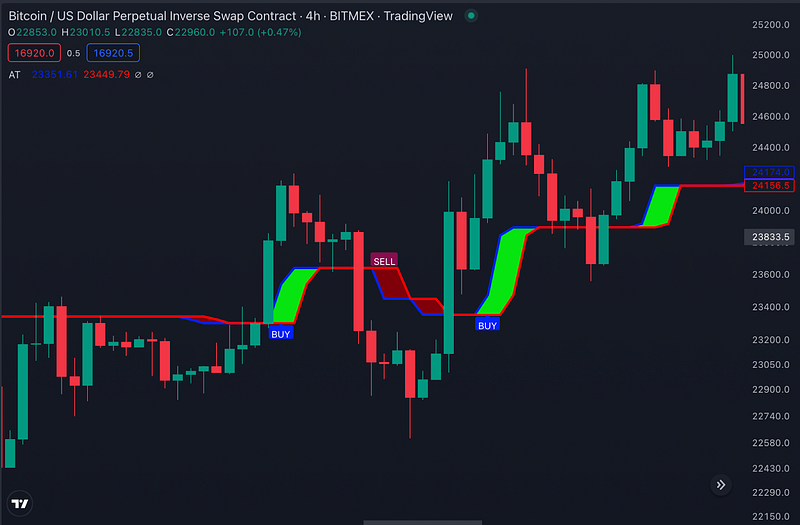
The Alpha Trend indicator is made up of two lines: the main line and a second line that lags behind it by 2 bars. When these lines intersect, traders can obtain certain trading levels.
A buy level is formed when the leading line crosses above the lagging line and the area between the lines turns green. Conversely, a sell level is formed when the leading line moves below the lagging line and the area between the lines turns red. When the Alpha Trend is a straight line, it indicates a waiting period.
In addition to crossovers, traders can also use the divergence between the cryptocurrency price and the Alpha Trend line to set trading points.
To create a winning strategy, traders can use the Alpha Trend indicator in combination with other indicators and analysis techniques to confirm potential levels. This approach provides a more comprehensive understanding of the market and can help traders make better decisions.
The default settings for Alpha Trend are a multiplier of 1 and a period of 14, and it’s typically used on daily and 4-hour bars. To optimize the indicator for smaller or larger chart intervals, traders can adjust the settings accordingly. It’s important to note that a “Buy” signal is always followed by a “Sell” signal, and vice versa.
Support and Resistance Levels for Alpha Trend Indicator
The Alpha Trend indicator is a helpful tool for identifying potential support and resistance levels, which can guide trading decisions. It can determine whether the market is in an uptrend, downtrend, or sideways trend, providing valuable insight into where the market might be headed.
In an uptrend, support levels can be found at previous resistance levels, providing good entry points for long-term trading. In a downtrend, support levels may be levels that were resistance to the price in the previous uptrend, providing good entry points for short-term trading. In a sideways market, support and resistance levels can be identified by areas where the market has hesitated or reversed in the past.
Alpha Trend works like long moving averages or hand-drawn trend lines, with the red sections indicating resistance during a downtrend. When the price reverses, Alpha Trend acts as support for the continuation of the trend.
While these guidelines can provide a general idea of support and resistance levels, it’s important to remember that they are not foolproof and should be used in combination with other indicators and analysis techniques.
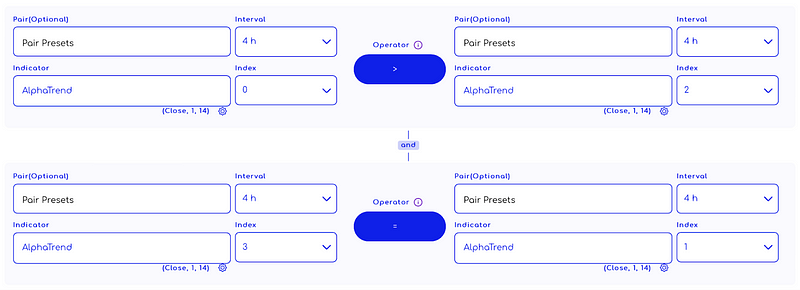
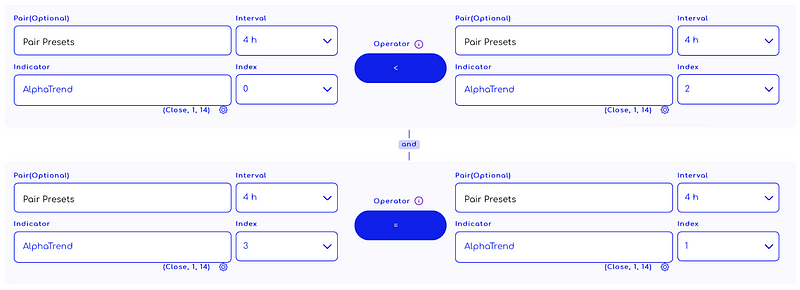
Alpha Trend Indicator at Traderlands Strategy Creator Tool
You can start creating a strategy by selecting the “AlphaTrend” indicator from the list. An example strategy is shown in the image below. You can use the Alpha Trend indicator to create a strategy after doing your own research.
Enter Algorithm Rules You Can Add To Strategy Creator
Exit Algorithm Rules You Can Add To Strategy Creator
WARNING: The entry and exit strategies in the images are prepared ONLY for educational purposes to explain how indicators work. It does not guarantee any profit.
When creating an algorithmic trading strategy, a rule set is usually created by using more than one indicator.
TradingView: https://www.tradingview.com/v/o50NYLAZ/