

BBP: Bull Bear Power Indicator
What is the Bull Bear Power Indicator?
Understanding market conditions is essential to successful crypto trading. The Bearish Bull Power Indicator measures the true strength of bearish and bullish trends in the market. This is done by comparing each trend with a 13-day EMA indicator.
The Bear Power indicator indicates a market tendency toward lower prices, while the Bullish Power indicator measures a tendency toward higher prices. Traders can use these indicators to set trading levels and make informed decisions about when to buy or sell. By analyzing all three indicators, traders can determine whether bear power or bull power is stronger and position themselves accordingly.
How to use the Bull Bear Power Indicator?
The Bearish Bullish Power indicator is a powerful tool for identifying trends in the market. If bullish power prevails, the market may rise, and the moving average will trend upwards.
Conversely, if bear power gains the upper hand, the market may decline, and the trend of the moving average will be downwards. These forces alternate with each other and stabilize the overall market of the asset. The bullish-bear power indicator is useful for trading any market.
To make the most of this indicator, it’s essential to identify the best possible levels at which to make changes. In a trending environment, it’s important to be patient and wait for the right trading levels.
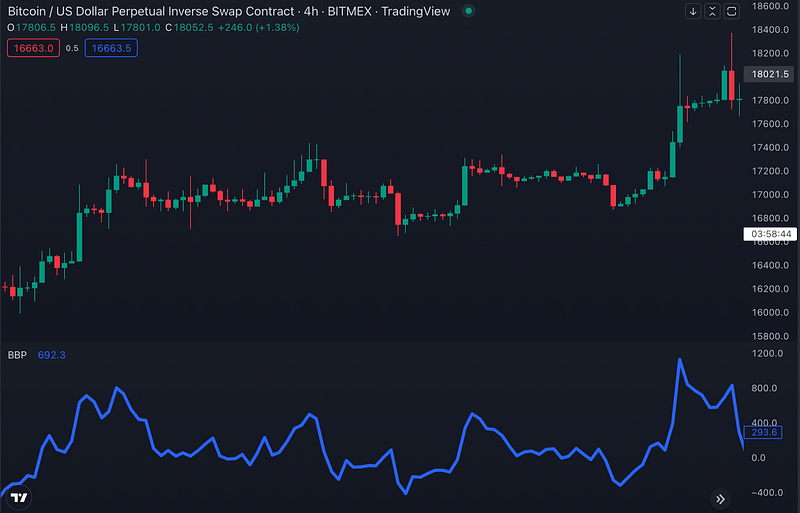
The Bull Bear Power indicator measures the distance between the EMA and the highest and lowest prices. This corresponds to the effects of bull and bear power on the market. The indicator can show both negative and positive values.
Positive values in the Bullish power indicator indicate bullish power, while negative values in the Bear power indicator show bearish power. By using this indicator, traders can make informed decisions about when to buy or sell, based on the current state of the market.
How to create a trading strategy with BBP Indicator?
The Bull Power indicator predicts the relative strength of buy orders to sell orders in the market. It does this by measuring whether the current price is higher than the previous one, with higher prices indicating greater bullish power. To calculate Bullish Power manually, you can use the formula:
Bullish Power = High price — Exponential Moving Average
Conversely, the Bear Power indicator estimates the relative strength of sell orders to buy orders in the market. It is the opposite of the Bull Power indicator, with lower prices indicating greater bearish power. To calculate Bearish Power manually, you can use the formula:
Bear Power = Low price — Exponential Moving Average
Traders can use the differences between the Bull Power and Bear Power indicators and the market to set trading levels. These indicators can be used in conjunction with trend indicators to make more informed decisions. For example, if the trend indicator is bearish and the Bullish Power index is moving downwards above zero, selling levels can be determined. Conversely, if the trend indicator is bullish and the Bearish Power index is moving upward from below zero, buying levels can be determined.
BBP indicator at Traderlands Strategy Creator Tool
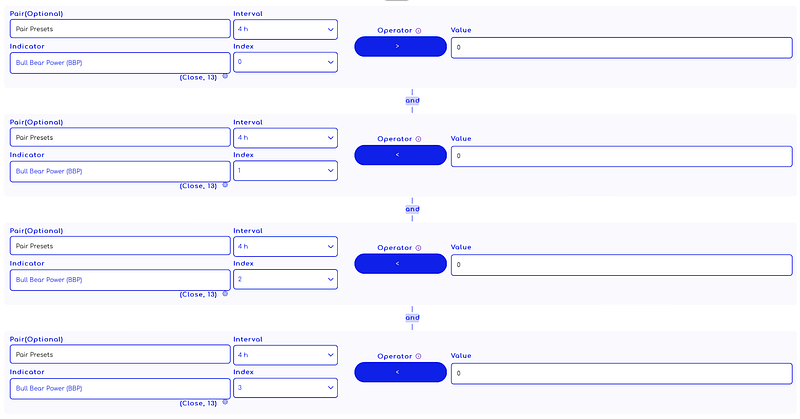
You can start creating a strategy by selecting the “Bull Bear Power (BBP)” indicator from the list. An example strategy is shown in the image below. You can use the Bull Bear Power indicator to create a strategy after doing your own research.
Enter Algorithm Rules You Can Add To Strategy Creator
Exit Algorithm Rules You Can Add To Strategy Creator
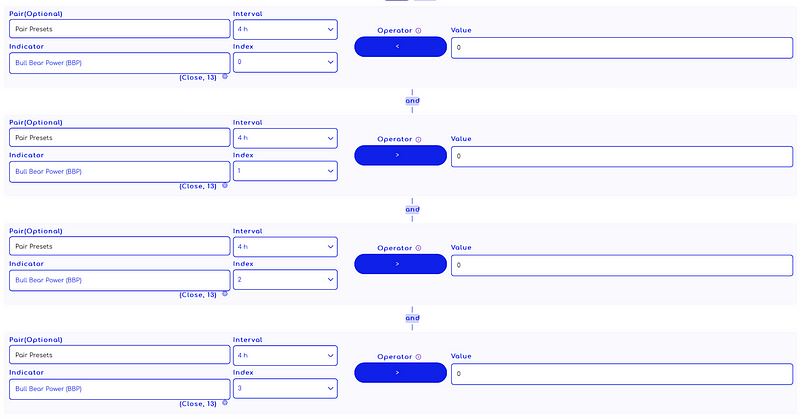
WARNING: The entry and exit strategies in the images are prepared ONLY for educational purposes to explain how indicators work. It does not guarantee any profit.
When creating an algorithmic trading strategy, a rule set is usually created by using more than one indicator.
Other Indicators can be used with the BBP Indicator
Bearish Bull Power can be combined with trend measurement indicators like the Exponential Moving Average (EMA) to help confirm trading levels and make informed decisions. These indicators can be tested to find the most suitable ones for your trading style, as each has its own strengths and weaknesses. Before using any strategy in real trades, it’s important to test it on historical data to assess its effectiveness.
By experimenting with different trend measurement indicators, traders can gain a better understanding of market trends and identify potential buying or selling opportunities. Using the EMA in conjunction with Bearish Bull Power can help traders confirm whether the market is trending up or down, and make more informed decisions based on this information.
In conclusion, traders should take the time to test different indicators and strategies before using them in real trades. By doing so, they can develop a better understanding of the market and identify the most effective trading strategies for their needs.