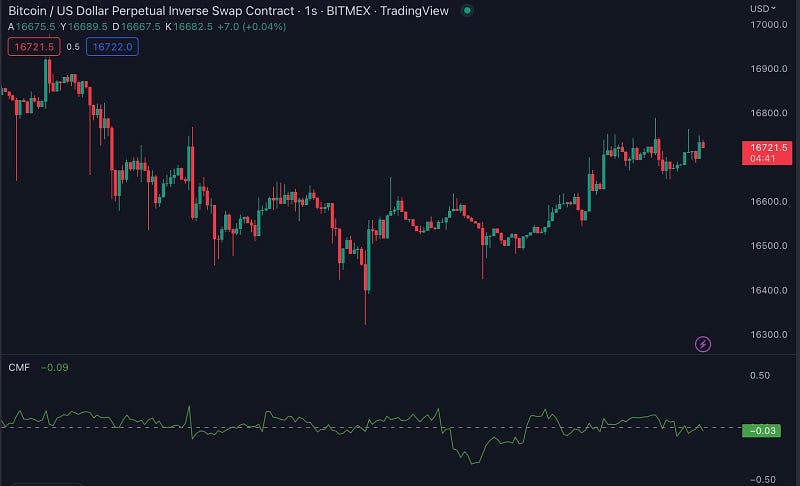
CMF: Chaikin Money Flow Indicator
The Chaikin Money Flow (CMF) indicator is a powerful technical analysis tool used by traders and investors to measure the buying and selling pressure in a market.
The CMF indicator, also known as the Chaikin Accumulation/Distribution indicator, examines the rate of increase and decrease in demand created by investors in a trading pair.
In this article, we will explain how the CMF indicator works, its benefits and how to use it to determine your own trading levels.
What is a Chaikin Money Flow Indicator?
The Chaikin Money Flow indicator uses the volume data of a trading pair to measure the amount of money entering and leaving the market.
It is calculated by taking the difference between the Accumulation/Distribution Line and the Simple Moving Average (SMA) of the crypto price and then multiplying this by the volume of the crypto.
This results in the Chaikin Money Flow line, which is plotted on a chart. Values above zero indicate money flowing into the market, while values below zero indicate money leaving the market.
The CMF indicator can be used to confirm current trends and identify potential trend reversals.
How to use the Chaikin Money Flow Indicator?

Chaikin Money Flow (CMF) is a technical analysis indicator used to measure buying and selling pressure in the market.
The Chaikin Money Flow indicator is calculated by taking the sum of all positive money flow over a given period and then dividing it by the sum of all negative money flow over that same period.
A reading above 0 indicates net buying pressure, while a reading below 0 indicates net selling pressure.
The Chaikin Money Flow indicator can be used in a number of ways, but one common use is to look for divergences between price and CMF.
For example, if the price is making new highs but CMF is failing to do so, this could be an early warning sign of potential weakness ahead.
Another way to use CMF is as a confirmation tool. For example, if the price is rising and CMF is also rising, this could be confirmation that the trend is indeed strong.
Support and Resistance Levels for Chaikin Money Flow Indicator
The Chaikin Money Flow Indicator is a technical indicator that measures the buying and selling pressure in the market.
The Chaikin Money Flow indicator can be used to identify support and resistance levels in the market. When the indicator is rising, it indicates buying pressure which can be used to identify support levels.
How to create a trading strategy with a Chaikin Money Flow Indicator
The way the Chaikin Money Flow is calculated clarifies what inferences should be drawn by those who trade with this indicator.
Chaikin Money Flow (CMF) Formula:
Money Flow Multiplier = ((Closing value — Low value) — (High value — Closing value)) / (High value — Low value)
Money Flow Volume = Money Flow Multiplier x Period Volume.
CMF = n Average Daily Money Flow / n Average Daily Volume
When two different data points are divided by each other, a high CMF value indicates buying pressure and a low CMF value indicates selling pressure.
The CMF can be used to create a trading strategy as follows:
1. Look for periods of strong buying or selling pressure as indicated by the CMF.
2. Enter a trade in the direction of the pressure (buy when CMF is positive, sell when CMF is negative).
3. Exit the trade when the pressure reverses (CMF turns negative when long, CMF turns positive when short).
Chaikin Money Flow Indicator at Traderlands Strategy Creator Tool
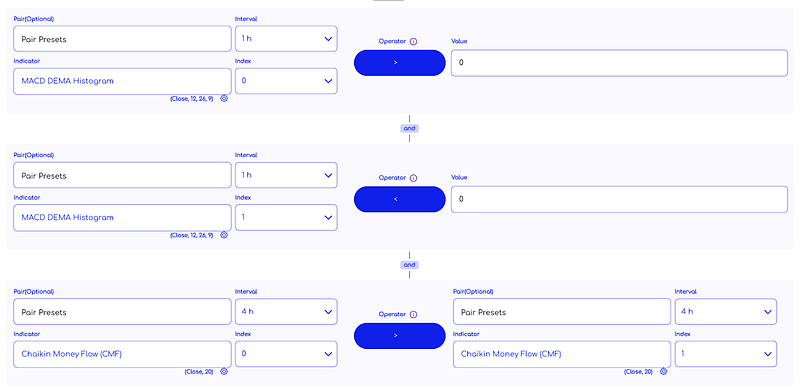
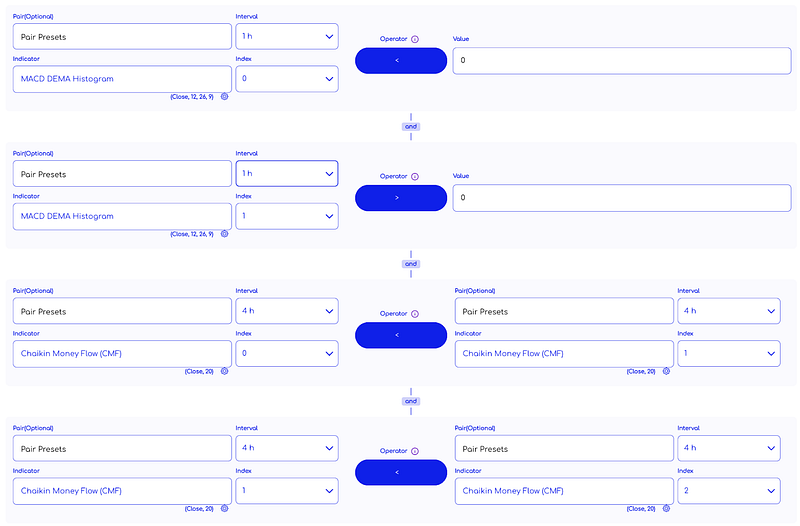
You can start creating a strategy by selecting the “Chaikin Money Flow (CMF)” indicator from the list. An example strategy is shown in the image below. You can use the CMF indicator to create a strategy after doing your own research.
Enter Algorithm Rules You Can Add To Strategy Creator

Exit Algorithm Rules You Can Add To Strategy Creator

WARNING: The entry and exit strategies in the images are prepared ONLY for educational purposes to explain how indicators work. It does not guarantee any profit.
When creating an algorithmic trading strategy, a rule set is usually created using more than one indicator.
Other Indicators can be used with the Chaikin Money Flow
There are a number of other indicators that can be used in conjunction with the Chaikin Money Flow indicator to provide a complete picture of market activity.
These include indicators such as the Relative Strength Index (RSI), Moving Average Convergence Divergence (MACD), and Stochastic Oscillator.
Each of these indicators can provide valuable information about price momentum and trend, which can help decide when to enter or exit a trade.
In addition, it is also important to pay attention to overall market conditions when using the Chaikin Money Flow indicator.
This means keeping an eye on things like the level of volatility, overall market sentiment, and economic news releases.
By doing this, you will be able to get a better sense of whether the market is likely to move in the direction indicated by the Chaikin Money Flow indicator.
TradingView: https://www.tradingview.com/chart/?solution=43000501974


