
EMA: Exponential Moving Average Indicator
The EMA, or Exponential Moving Average, is a technical indicator that is used by traders to identify trend direction and potential trade entry and exit points.
The EMA is calculated by taking a certain number of the most recent price data points and weighting them according to their distance from the current period.
The EMA is a lagging indicator, which means that it is based on past price data and as such, it is not perfectly accurate.
In this blog post, we will take a look at what the EMA is, how it is calculated, and how you can use it in your trading.
What is the EMA Indicator?
An Exponential Moving Average (EMA) is a type of moving average that places a greater weight and emphasis on the most recent data points.
The Exponential Moving Average is also referred to as the exponentially weighted moving average.
The EMA calculation places more importance on recent prices than the Simple Moving Average (SMA), which gives equal weight to all values.
EMA = Price(t)*k + EMA(y-1)*(1-k)
t = current day
y = number of days in the EMA period
k = 2/(y+1)
EMA(0)= SMA(y)
How to use an EMA Indicator?
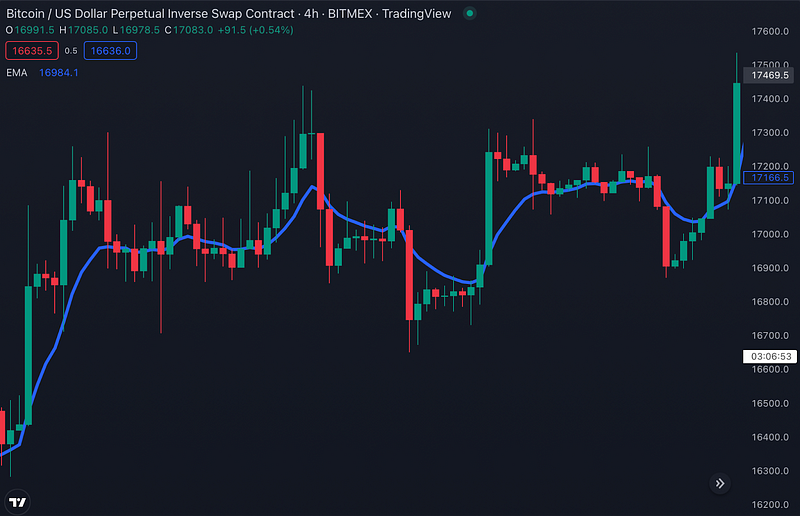
The Exponential Moving Average is a tool that traders can use to identify potential trading entry/exit levels. The Exponential Moving Average is calculated by averaging the past “n” prices, which can usually be set at 20, 30, 50, or 100. Parameters may vary according to traders’ strategies and multiple EMAs with different parameters can be used in the same pair to compare and identify the trend.
The EMA indicator is considered to be a lagging indicator, which means that it can be used to confirm trends that have already been established.
When the price is above the EMA indicator value, it indicates that the trend is up. Conversely, when the price is below the EMA indicator value, it indicates that the trend is down.
Traders can use the EMA indicator to enter and exit trades. For example, if the EMA indicator is above the price and rising, a trader might buy in anticipation of further price increases.
On the other hand, if the EMA indicator is below the price and falling, a trader might sell in anticipation of further price decreases.
It’s important to keep in mind that the EMA indicator is just one tool that traders can use to make informed trading decisions.
In addition to using indicators, traders should also pay attention to overall market conditions and news releases that could impact prices.
Support and Resistance Levels for EMA
There are two types of support and resistance levels for EMA — static and dynamic.
The static level is determined by the price action of the past and present, while the emotional level is more volatile and changes with time.
The most important thing to remember about support and resistance levels is that they are not set in stone — they can change over time.
When determining support and resistance levels for EMA, there are a few things to keep in mind:
-Look at previous price action
-Look for areas where the price has reversed or stalled
-Identify key Fibonacci levels
-Use other technical indicators to confirm support and resistance levels
How to create a trading strategy with EMA
There are many ways to create a trading strategy with EMA. One way is to use the EMA crossover method. This method is based on the concept that when the shorter-term EMA crosses above the longer-term EMA, it signals that a bullish trend may be developing.
Conversely, when the shorter-term EMA crosses below the longer-term EMA, it signals that a bearish trend may be developing.
Another way to use EMA in your trading strategy is by watching for price action at or near the EMAs. When prices are trading near the EMAs, it may signal that a reversal is about to occur.
For instance, if prices are near resistance and the 9 days, you might watch for a bearish reversal candlestick pattern to form before shorting the stock.
Some traders also like to use exponential moving averages in conjunction with other technical indicators, such as Bollinger Bands or MACD.
EMA at Traderlands Strategy Creator Tool
You can start creating a strategy by selecting the “Exponential Moving Average (EMA)” indicator from the list. An example strategy is shown in the image below. You can use the EMA indicator to create a strategy after doing your own research.
Enter Algorithm Rules You Can Add To Strategy Creator
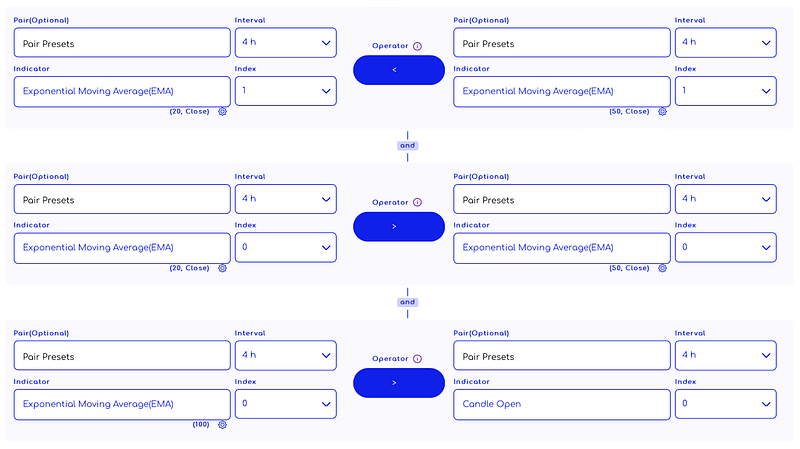
Exit Algorithm Rules You Can Add To Strategy Creator

*Creating an exit algorithm by using just the EMA to make the decision may not be very accurate. It’s better to also use RSI or another indicator to make sure you make the right call.*
WARNING: The entry and exit strategies in the images are prepared ONLY for educational purposes to explain how indicators work. It does not guarantee any profit.
When creating an algorithmic trading strategy, a rule set is usually created by using more than one indicator.
Conclusion
In conclusion, the EMA is a very useful tool that can help you make better investment decisions.
It is not perfect, but it can give you an edge over other investors who do not use this tool. I encourage you to experiment with it and see how it can help you achieve your investing goals.