Ichimoku Indicator on Traderlands
The Ichimoku indicator is a Japanese charting tool that has become popular among traders in recent years. The indicator can be used to identify trends and support and resistance levels, making it a valuable tool for both long-term and short-term trading.
In this article, we will take a look at the Ichimoku indicator and how it can be used to trade the markets. We will also discuss some of the key things to look for when using this indicator.
So, whether you are new to the Ichimoku indicator or have been using it for some time, be sure to read on!
What is an Ichimoku Indicator?
The Ichimoku indicator is a technical tool that can be used to measure momentum and identify potential areas of support and resistance.
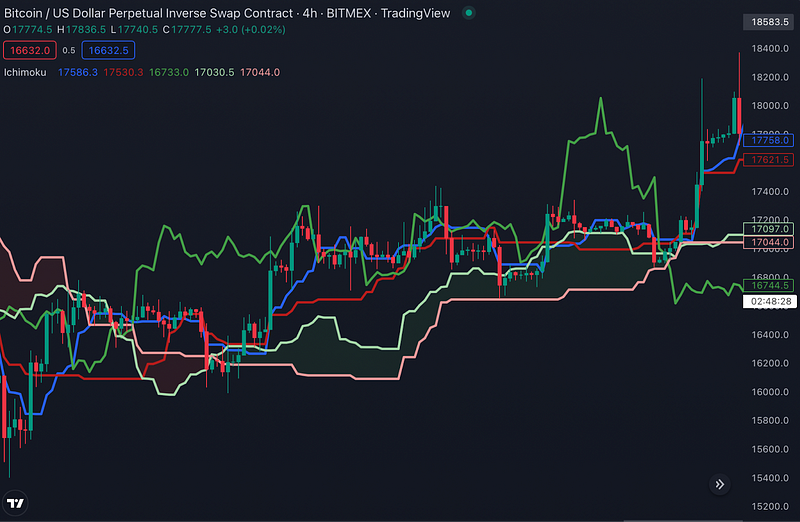
The indicator consists of five lines, which are referred to as the Tenkan-sen, Kijun-sen, Senkou Span A, Senkou Span B, and Chikou Span. These lines are plotted on a price chart and can be used to generate buy and sell signals.
The Tenkan-sen is the shortest of the five lines and is considered to be the most important. It is calculated by taking the highest high and the lowest low over the past nine periods. The Kijun-sen is the next longest line and it is calculated by taking the highest high and the lowest low over the past 26 periods.
The Senkou Span A is plotted 26 periods ahead of the current period and is equal to the average of the tenkan-sen and kijun-sen. The Senkou Span B is plotted 52 periods ahead of the current period and is equal to the average of the highest high and lowest low over the past 52 periods.
The Chikou Span is plotted 26 periods behind the current period and shows where the price was about recent highs and lows.
The Ichimoku indicator can be used in a number of ways, but one common use is to look for crossovers between the different lines.
For example, a buy signal would be generated when the price crosses above both Senkou Span A and Senkou Span B.
Another way to use the Ichimoku indicator is to look for price action that is taking place in the cloud. If the price is trading above the cloud, then this is generally seen as bullish. Conversely, if the price is trading below the cloud, then this is generally seen as bearish.
The Ichimoku indicator can be a useful tool for traders who are looking to identify potential areas of support and resistance. It can also be used to measure momentum and generate buy and sell signals.
The indicator is not without its critics, however, and some argue that it is too complex and difficult to use. Others argue that the indicator gives too many false signals. Ultimately, it is up to the individual trader to decide if the Ichimoku indicator is right for them.

How to use Ichimoku Indicator?
The Ichimoku indicator can be used in two ways: as a standalone tool to assess market conditions and identify potential trading opportunities, or as a confirmation tool in conjunction with other technical indicators or price patterns.
When used as a standalone tool, the Ichimoku indicator can help traders to identify trends, support, resistance levels, and potential reversals. The indicator can also be used to generate buy and sell signals. For example, a buy signal is generated when the Tenkan-sen crosses above the Kijun-sen, and a sell signal is generated when the Tenkan-sen crosses below the Kijun-sen.
The Ichimoku indicator is a powerful tool that can help traders identify trends and make better trading decisions. But, like any other indicator, it has to be used correctly to be effective.
Here are a few tips on how to use the Ichimoku indicator:
1. Use the Ichimoku cloud to identify trends. The cloud is composed of two lines: the Tenkan-sen (red line) and the Kijun-sen (blue line). If the Tenkan-sen is above the Kijun-sen, it indicates an uptrend. Conversely, if the Tenkan-sen is below the Kijun-sen, it indicates a downtrend.
2. Use the Kumo Cloud to identify support and resistance levels. The Kumo Cloud is made up of two lines: the Senkou Span A and the Senkou Span B. These lines act as support and resistance levels, respectively.
3. Use the Chikou Span to confirm trends. The Chikou Span is lagging behind price action but can be used to confirm trends. If price action is above the Chikou Span, it confirms an uptrend. Similarly, if price action is below the Chikou Span, it confirms a downtrend.
Support and Resistance Levels for Ichimoku Indicator
The Ichimoku indicator can be used to identify support and resistance levels in the market. The indicator consists of five lines: the tenkan-sen, the kijun-sen, the Senkou Span A, the Senkou Span B, and the Chikou Span.
The Tenkan-sen is also known as the conversion line, and it is used to indicate the short-term trend in the market. The Kijun-sen is also known as the baseline, and it is used to indicate the long-term trend in the market.
The Senkou Span A is also known as the leading Span A, and it is used to identify potential support and resistance levels ahead of time.
The Senkou Span B is also known as the leading Span B, and it identifies potential turning points in the market. The Chikou Span is also known as the lagging span, and it confirms trends that have already been established.
When all five lines are taken into consideration, they can provide a clear picture of where support and resistance levels are located in the market. These levels can be used to make informed trading decisions.
How to create a trading strategy with Ichimoku Indicator
When it comes to creating a trading strategy with Ichimoku, there are a few things you need to keep in mind. First of all, you need to make sure that your chart is set up correctly.
This means having the right time frame and the correct settings for the Ichimoku indicator. Once you have this setup, you need to look for certain patterns and signals that the Ichimoku indicator will give you.
Some of the most common patterns and signals that traders look for with Ichimoku are
The Tenkan-Sen/Kijun-Sen Cross: This is a bullish signal that occurs when the Tenkan-Sen (red line) crosses above the Kijun-Sen (blue line). This indicates that prices are likely to continue moving higher.
The Kumo Twist: This is a bullish signal that occurs when the Senkou Span A crosses above the Senkou Span B. This indicates that prices are likely to continue moving higher.
The Chikou Span Cross: This is a bearish signal that occurs when the Chikou Span (lagging line) crosses below the price action. This indicates that prices are likely to continue moving lower.
These are just a few of the many signals and patterns that traders look for with Ichimoku. If you can learn to identify these signals, then you will be well on your way to creating a successful trading strategy with Ichimoku.
Ichimoku Indicator at Traderlands Strategy Creator Tool
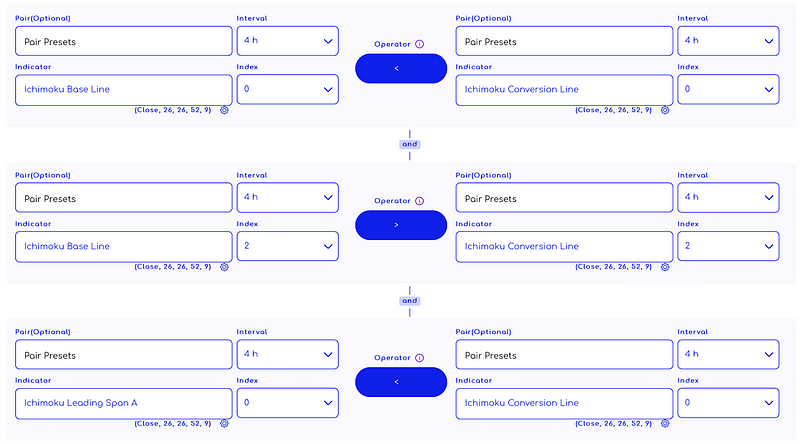
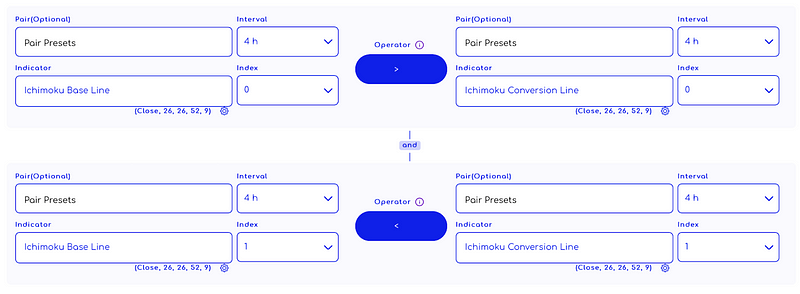
You can start creating a strategy by selecting “Ichimoku Base Line”, “Ichimoku Conversion Line”, “Ichimoku Lagging Span”, “Ichimoku Leading Span A” and “Ichimoku Leading Span B” from the list. An example strategy is shown in the image below. You can use the Ichimoku indicator to create a strategy after doing your own research.
Enter Algorithm Rules You Can Add To Strategy Creator

Exit Algorithm Rules You Can Add To Strategy Creator

WARNING: The entry and exit strategies in the images are prepared ONLY for educational purposes to explain how indicators work. It does not guarantee any profit.
When creating an algorithmic trading strategy, a rule set is usually created by using more than one indicator.
Other Indicators can be used with the Ichimoku
Other indicators can be used in conjunction with the Ichimoku, to help confirm signals and provide additional context. Some popular indicators to use with the Ichimoku indicator are:
-The Relative Strength Index (RSI): The RSI is a momentum oscillator that can be used to identify overbought and oversold conditions. When used in conjunction with Ichimoku, the RSI can help confirm price movements.
-The Moving Average Convergence Divergence (MACD): The MACD is a trend-following indicator that can be used to identify the direction of the overall trend. When used in conjunction with Ichimoku, the MACD can help confirm price movements.
- Bollinger Bands: Bollinger Bands are a volatility indicator that can be used to identify periods of high or low volatility. When used in conjunction with Ichimoku, Bollinger Bands can help confirm price movements.


