MOST Indicator and Algorithmic Trading
The Moving Stop Loss is a powerful technical analysis tool for algorithmic trading. It can be easily applied in any market, allowing traders to make well-informed decisions.
It uses the combination of Exponential Moving Average and Trailing Stop to predict price movements, establish trading levels and set stop loss levels.
We’ll dive deeper into how it can be used in this article by providing insight on how to craft a successful trading strategy utilizing this tool.
What is MOST Indicator?
One of the important things for traders is choosing the right arsenal to compete in real-time trading 24/7.
The MOST Indicator is a versatile technical analysis tool designed for identifying price movements and making trades. It can be applied to any market and timeframe, making it a valuable asset for traders.
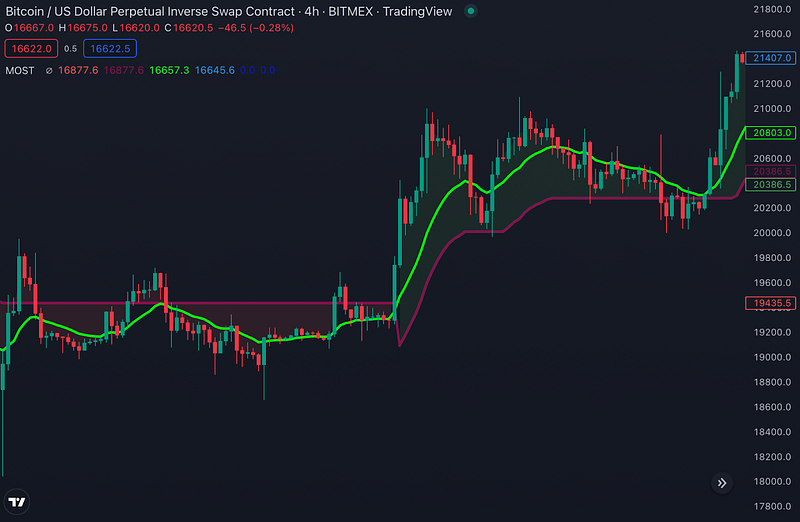
It comprises two lines, the MOST line, and the ExMov line. The ExMov line stands for the exponential moving average which is formulated to respond more rapidly to changes in price. The MOST line, on the other hand, is intended to confirm the reversal points detected by the ExMov line.
The MOST indicator can be employed as a standalone tool or in conjunction with other technical indicators, which helps to validate the trade signals generated by the other ones. This versatile combination of technical indicators can be used as a strategy to maximize trading efficiency in any market.

How to use the MOST Indicator?
MOST helps to set trade levels and stop loss levels at certain points.
The MOST indicator consists of two lines, MOST and ExMov. ExMov expresses exponential moving averages, while the MOST line follows the ExMov line a little behind and is used to confirm the reversal points created by ExMov.
A buy level occurs when the ExMov crosses the MOST lineup, and a sell level occurs when the ExMov line crosses the MOST line.
The MOST indicator can be one of the indicators you can use when designing a strategy. Also, as with other indicators, it is important to pay attention to risk management and use technical analysis tools together when trading.
Support and Resistance Levels for MOST
The MOST indicator can be used to identify support and resistance levels in a coin’s price history.
Support and resistance levels are important to traders because they can be used to make predictions about where the price of a coin will move in the future.
The MOST indicator is a useful tool for finding these levels. To find support and resistance levels using MOST, it is necessary to look for areas where the price reverses direction after reaching a new high or low.
How to create a trading strategy with MOST
There is no one size fits all approach when it comes to trading. The Traders need to develop a strategy that suits their style and preferences.
The MOST indicator can be a valuable tool for developing a trading strategy. You can commonly use the MOST indicator when designing a strategy to identify trading security and stop loss.
A buy level occurs when the ExMov crosses the MOST lineup, and a sell level occurs when the ExMov line crosses the MOST line.
MOST at Traderlands Strategy Creator Tool
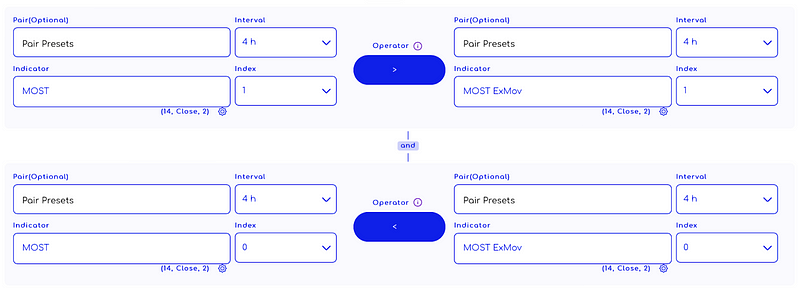
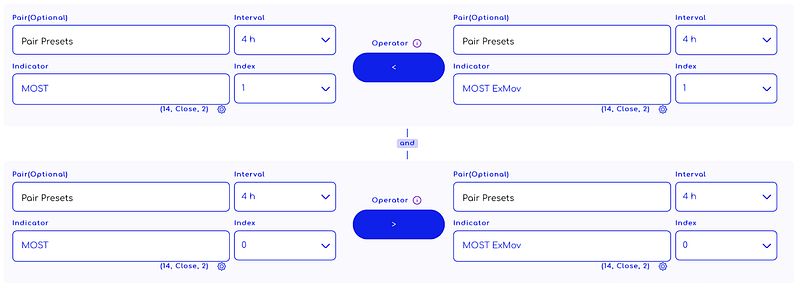
You can start creating a strategy by selecting “MOST” and “MOST.ExMov” from the list. An example strategy is shown in the image below. You can use the MOST indicator to create a strategy after doing your own research.
Enter Algorithm Rules You Can Add To Strategy Creator

Exit Algorithm Rules You Can Add To Strategy Creator

WARNING: The entry and exit strategies in the images are prepared ONLY for educational purposes to explain how indicators work. It does not guarantee any profit.
When creating an algorithmic trading strategy, a rule set is usually created by using more than one indicator.
Other Indicators can be used with the MOST
There are several choices along with the MOST indicator to create a solid trading strategy.
Include a few of the usage indicators with MOST.
-RSI
-CCI
- Stochastic Oscillator
If more than one indicator in the created strategy shows the same trading level, this indicates that the level of accuracy is higher and that it should be acted upon accordingly. However, if there is cumulative information found among the indicators, it would be best to wait until further clarity.
TradingView: https://www.tradingview.com/v/28ZcW4nv/


