OTT: Optimized Trend Tracker Indicator and Trading
The Optimized Trend Tracker (OTT) is a popular technical indicator among traders for determining the overall trend of the market. This indicator utilizes the concept of price movement to generate buy and sell signals.
In this blog post, we will explore the usage of the Optimized Trend Tracker and show you how to create effective trading strategies using the OTT on Traderlands.
How to use the OTT Indicator?
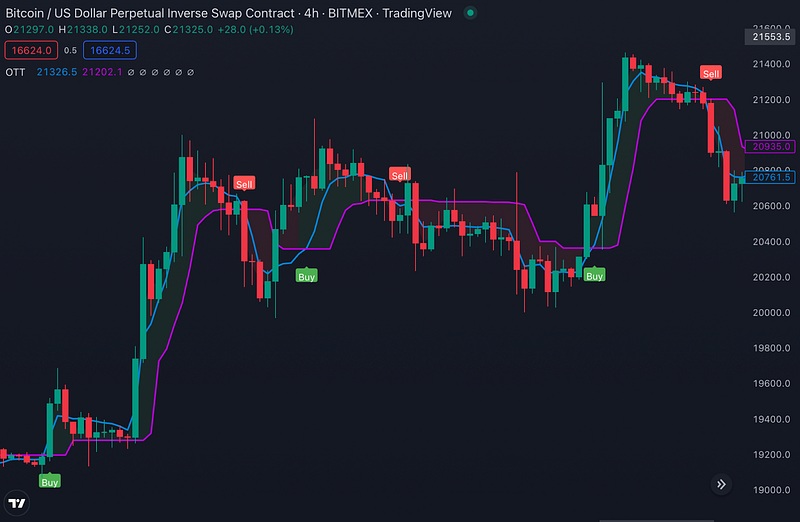
The Optimized Trend Tracker (OTT) is an effective tool for identifying whether a market is in an uptrend, downtrend, or in sideways trend. The indicator tracks the trend by monitoring the movement of prices above or below the band. If prices remain consistently above the OTT line, it is an indication of an uptrend, and if prices remain consistently below the OTT, it is a sign of a downtrend.

The Optimized Trend Tracker (OTT) is a powerful technical indicator that traders use to determine the market trend. It consists of two lines, with the first line, in purple, being the OTT itself. This line shows the direction in which prices are moving in relation to themselves. Despite being a short-term indicator that is calculated based on current prices, the OTT does not react immediately to price movements. Instead, it first analyzes market conditions before making a move.
The OTT has two parameters — the period (length) and OTT Percent. The period has a significant impact on the shape of the OTT, with a larger number resulting in a smoother line, and a smaller number leading to a harder line. The OTT Percent parameter, on the other hand, influences the location of the OTT, with smaller values causing the line to closely follow prices and react quickly to movements, and larger values leading to an OTT that is less affected by price movements and follows them from a further distance.
Using the OTT is simple and straightforward. Traders can enhance their trading experience by using the OTT in conjunction with its floating moving average, known as the Support Line. This support line is calculated based on the same period as the OTT. Additionally, traders can use two OTT lines to define more precise buy and sell levels. A price that breaks above both OTT lines can be considered a buy level, indicating an uptrend, while a price that goes below both OTT lines can be considered a sell level, indicating a downtrend.
Finally, the OTT can be used in conjunction with other technical indicators to provide more robust and informed buy and sell signals. There are various combinations of indicators that traders can use to design effective trading strategies.
Optimized Trend Tracker Indicator at Traderlands Strategy Creator Tool
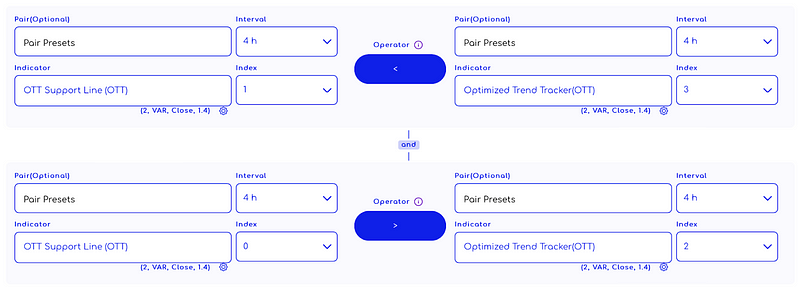
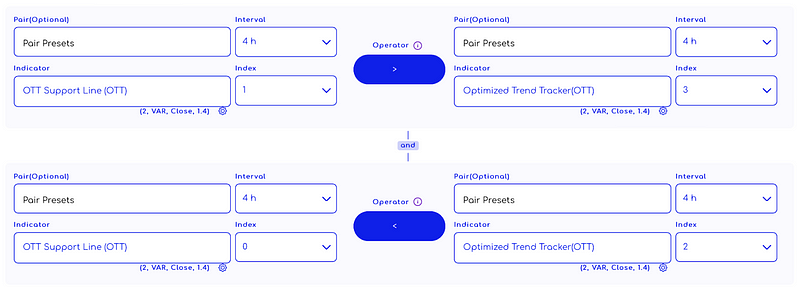
You can start creating a strategy by selecting “Optimized Trend Tracker (OTT)” and “OTT Support Line (OTT)” from the list. An example strategy is shown in the image below. You can use the OTT indicator to create a strategy after doing your own research.
Enter Algorithm Rules You Can Add To Strategy Creator

Exit Algorithm Rules You Can Add To Strategy Creator

WARNING: The entry and exit strategies in the images are prepared ONLY for educational purposes to explain how indicators work. It does not guarantee any profit.
When creating an algorithmic trading strategy, a rule set is usually created by using more than one indicator.
TradingView: https://www.tradingview.com/v/zVhoDQME/
YouTube: https://www.youtube.com/watch?v=f4v46irHKaY


