ROC: Rate of Change Indicator
The Rate of Change (ROC) indicator represents a valuable technical analysis tool for traders, providing insight into potential future trends and changes in the market.
As a leading indicator, ROC measures the rate of change of a security’s price over a specific period and can be used to detect trend reversals, trend continuation, and overbought or oversold conditions.
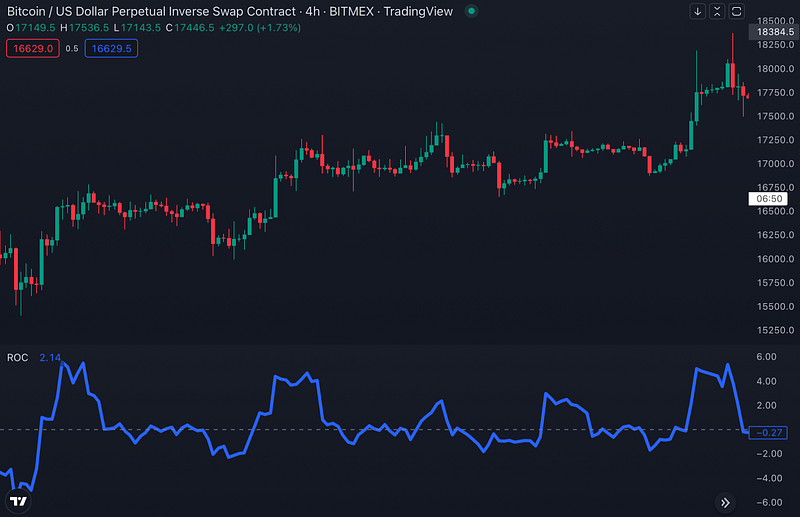
To calculate ROC, the current price is compared with the price “n” periods ago, the resulting plot forms an oscillator that oscillates above and below the zero line as the price changes direction.
The number of periods used to calculate ROC can be adjusted, with 9 being the most common setting.
In this blog post, we will delve into the intricacies of the Rate of Change (ROC) Indicator, its calculation, and how it can be applied to gain a deeper understanding of the market sentiment and make informed trading decisions.
What is Rate of Change (ROC) Indicator?
A momentum oscillator is used in technical analysis to measure the speed at which the price of a security is changing over time, by comparing the current price with the price “n” periods ago.
The ROC indicator is a leading indicator that helps traders to predict future trends and changes in the market by detecting trend reversal, trend continuation, and overbought/oversold conditions.
The number of periods used to calculate ROC can be adjusted but commonly 9 periods are used, Rate of Change (ROC) indicator is one of the powerful tools that can be used by traders to make informed decisions.

How to use Rate of Change Indicator?
The Rate of Change indicator is a momentum oscillator that measures the per cent change in price over a given period. The ROC calculation compares the current price with the price “n” periods ago.
The default look-back period for the ROC is 9, but this can be changed by the user.
There are two ways to interpret the ROC:
- As an oscillator, it is used to identify overbought and oversold conditions in the market. When the ROC is above zero, it indicates that prices are rising; when below zero, prices are falling. An increase in the indicator from one period to the next shows acceleration, while a decrease shows deceleration.
- As a leading indicator, it can be used to predict future changes in prices. A rise in the ROC may foreshadow a continued rally, while a fall may suggest an impending reversal to the downside.
Support and Resistance Levels for Rate of Change Indicator
The rate of change indicator (ROC) measures the per cent change in price from one period to the next. The ROC is displayed as a line that oscillates above and below the zero line as the price changes.
There are two types of support and resistance levels for the ROC indicator:
1. Absolute levels: These are determined by calculating the highest high and lowest low over a given time. For example, if you’re looking at a 10-day ROC, you would calculate the highest high and lowest low over the last 10 days.
2. Relative levels: These are determined by calculating the highest high and lowest low for a shorter period of time within a longer timeframe.
For example, if you’re looking at a 50-day ROC, you could calculate the relative levels by finding the highest high and lowest low over the last 5 days, 10 days, or 20 days.
The most important thing to remember when using support and resistance levels with the ROC indicator is that they are dynamic, which means they can change over time. That’s why it’s important to recalculate them regularly.
How to create a trading strategy with Rate of Change Indicator?
If you want to create a trading strategy with the Rate of Change indicator (ROC), there are a few things you need to keep in mind.
First, the ROC indicator is best used to identify trend changes, not to predict future prices. Second, when using the ROC indicator, it’s important to look for divergences between the indicator and price.
A divergence occurs when the ROC indicator moves in the opposite direction of the price. This can be an early warning sign that a trend change is coming.
To trade with the ROC indicator, you can use it to generate buy and sell signals. A buy signal occurs when the ROC indicator crosses above the zero line.
This means that momentum is increasing and the price is likely to continue moving higher. A sell signal occurs when the ROC indicator crosses below the zero line. This means that momentum is decreasing and the price is likely to start falling.
It’s also important to note that The Rate of Change indicator (ROC) is a lagging indicator, which means it will only tell you what has happened in the past, not what will happen in the future. For this reason, it’s important to combine the ROC indicator with other technical indicators or analysis tools before making any trading decisions.
Rate of Change (ROC) at Traderlands
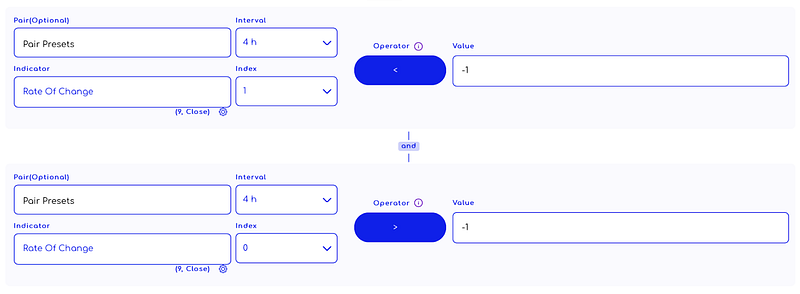
You can start creating a strategy by selecting the “Rate Of Change” indicator from the list. An example strategy is shown in the image below. You can use the Rate Of Change indicator to create a strategy after doing your own research.
Enter Algorithm Rules You Can Add To Strategy Creator

Exit Algorithm Rules You Can Add To Strategy Creator

WARNING: The entry and exit strategies in the images are prepared ONLY for educational purposes to explain how indicators work. It does not guarantee any profit.
When creating an algorithmic trading strategy, a rule set is usually created by using more than one indicator.
Other Indicators can be used with the Rate of Change
Other indicators can be used in conjunction with the Rate of Change indicator to help confirm trend changes or generate buy and sell signals.
For example, the Relative Strength Index (RSI) is a popular momentum oscillator that can be used to identify overbought and oversold conditions.
When the RSI is combined with the ROC indicator, it can provide even more information about the strength of a trend.
If the ROC is rising and the RSI is also rising, this may be indicative of a strong uptrend. Conversely, if the ROC is falling and the RSI is also falling, this may be indicative of a strong downtrend.
Many other indicators can be used in conjunction with the ROC indicator to help confirm trend changes or generate trading signals. Some other popular examples include Moving Averages, Bollinger Bands, MACD, and Stochastic Oscillators.


