SuperTrend Indicator and Algorithmic Trading
The SuperTrend Indicator is a highly popular trend-following tool that traders use to determine the direction and strength of the market trend. It is based on the Average True Range (ATR), which measures volatility, making it an effective tool for detecting support and resistance levels.
The SuperTrend Indicator can be described in three main ways: as a trailing stop indicator, as an ATR-based indicator, and as an effective tool for trend following and support/resistance detection.
In this blog post, we will explore how to use the SuperTrend Indicator, which is a favorite among traders. We will examine its workings, and how it can be used to design effective trading strategies on the Traderlands platform. By understanding the SuperTrend Indicator, traders can make informed decisions and enhance their trading experience.
What is the SuperTrend Indicator?
The SuperTrend Indicator is a technical analysis tool that traders use to make informed decisions and identify market trends. It is based on the Average True Range (ATR) and is an easy-to-use indicator with a single line. The SuperTrend calculation uses two modifiable parameters: the period of the ATR and the multiplier of the ATR value.
The calculation of the SuperTrend Indicator involves the use of the average of the highest and lowest price of the day (HL/2), and the application of the multiplier and the ATR to generate a buy and sell signal. The buy condition is determined by subtracting the multiplier times the ATR (Period) from HL/2, while the sell condition is determined by adding the multiplier times the ATR (Period) to HL/2.
It consists of a single line. It is a very easy-to-use indicator. Two modifiable parameters are used in the SuperTrend calculation:
- Period→ the period of the ATR period within
- Mutiplier→ Multiplier of ATR Value
SuperTrend calculation:
Buy Condition: HL/2 — Multiplier * ATR(Period)
Sell Condition HL/2 + Multiplier * ATR(Period)
HL = Average of the highest and lowest price of the day
What are the Advantages and Disadvantages of the Super Trend Indicator?
Pros
1- Ability to Follow Trends: Super Trend effectively follows the trend of the market and provides reliable signals.
2- Versatile: Suitable for use with a variety of investment instruments.
3- Effective at Lower Timeframes: Can work well even at low chart timeframes and generates more meaningful signals as the timeframe increases.
4- Improved Support and Resistance Detection: Helps to detect support and resistance levels more effectively.
Cons
1- It may generate erroneous signals in horizontal markets. In this case, it is recommended by its creators to use the multiplier by enlarging it.
2- Limited Effectiveness in Sideway Markets: This may generate false signals in markets with low-depth price movement.
3- Increased Risk with Larger Multipliers: As the multiplier increases, the risk of a change in direction also increases.
4- Not Ideal Low-volume pairs: These may not provide meaningful results when used with low-volume pairs.
How To Use the SuperTrend Indicator?
Super Trend is a trend-following indicator that helps traders determine the direction and strength of the trend by using the Average True Range (ATR). It displays a single line on the chart, making it easy to use. The indicator has two adjustable parameters: the period of the ATR and the multiplier of the ATR value.
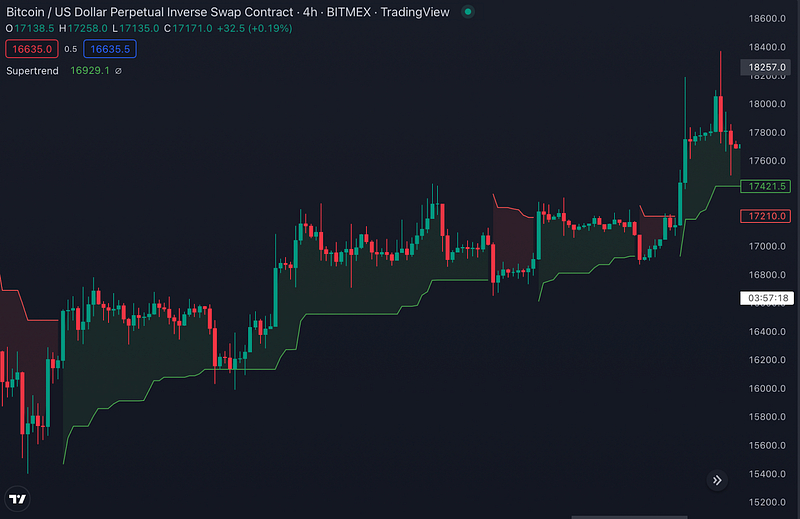
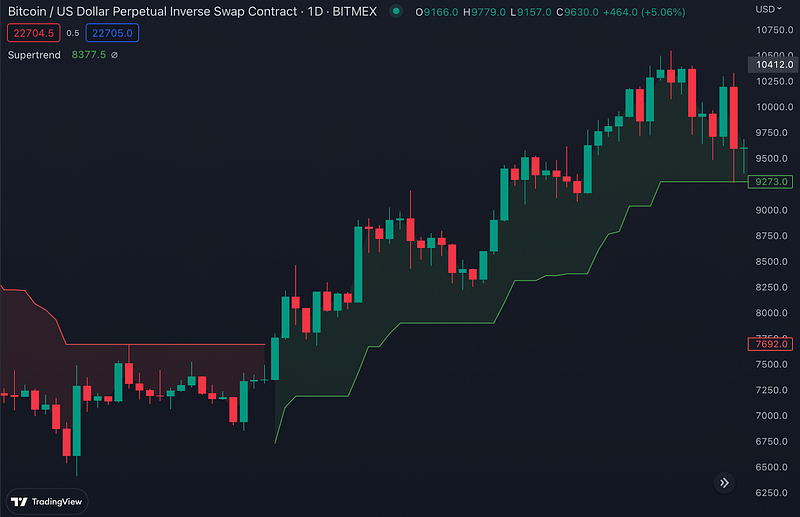
The SuperTrend line is displayed in green when it indicates an uptrend and in red when it indicates a downtrend. Buy levels are formed when the market moves from a downtrend to an uptrend and sell levels are formed when the market moves from an uptrend to a downtrend. Traders can use the SuperTrend indicator on any timeframe, but it’s commonly used on 4-hour or daily timeframes.
The default parameters for the Super Trend indicator are an ATR of 10 periods and a factor of 3. However, traders can adjust these parameters to suit their personal preferences or market conditions. For instance, in a more volatile market, using a longer ATR value can help avoid false trading signals.
Overall, Super Trend is a versatile and straightforward indicator that can help traders make better trading decisions.
Support and Resistance Levels for SuperTrend
The SuperTrend indicator is a technical indicator that can be used to identify support and resistance levels in the market.
When the SuperTrend line is below the prices, it signals an uptrend, and when it is above the prices, it signals a downtrend. The flatter the SuperTrend line, the more effective it acts as support and resistance, providing key levels for traders to watch for potential price bounces.
The SuperTrend indicator is easy to use and can be applied to any time frame, but it is commonly used on 4-hour or daily charts. The default parameters for SuperTrend are an ATR of 10 periods and a factor of 3, but these can be adjusted according to market conditions or personal preferences.
SuperTrend at Traderlands Strategy Creator Tool
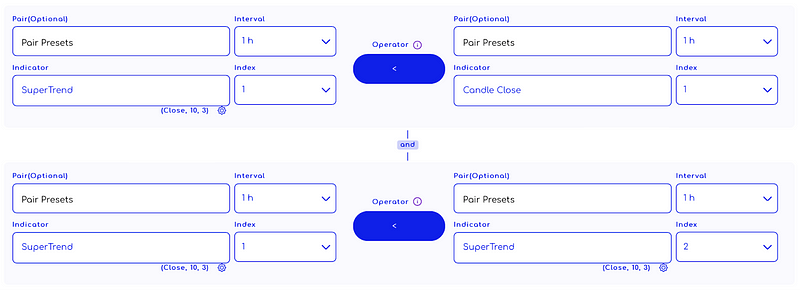
You can start creating a strategy by selecting the “SuperTrend” indicator from the list. An example strategy is shown in the image below. You can use the Super Trend indicator to create a strategy after doing your own research.
Enter Algorithm Rules You Can Add To Strategy Creator
Exit Algorithm Rules You Can Add To Strategy Creator
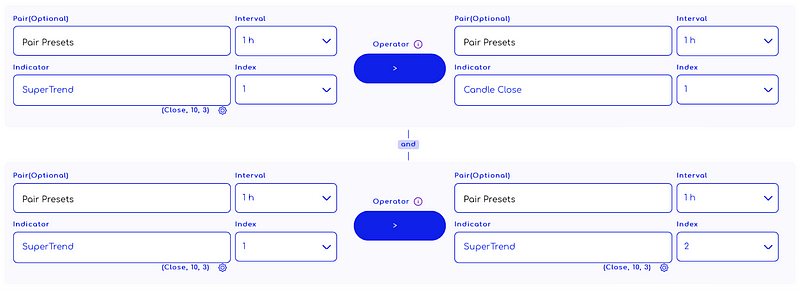
WARNING: The entry and exit strategies in the images are prepared ONLY for educational purposes to explain how indicators work. It does not guarantee any profit.
When creating an algorithmic trading strategy, a rule set is usually created by using more than one indicator.
Other Indicators can be used with the SuperTrend
For a more detailed analysis, many other indicators can be used together with the Super Trend indicator. Let’s take a look at which indicators SuperTrend can be used with.
As mentioned above, there is volatility in SuperTrend and volatility is measured by ATR. Therefore, it is preferable to use it with other indicators instead of volatility indicators. Optionally, it can also be used with volatility indicators, but it will not be a meaningful combination as they mean the same thing even if they work in harmony. For example, Keltner Channels and Bollinger Bands.
Similarly, it would not make much sense to use them in combination with Trailing Stop indicators as they both serve the same purpose. For example, MOST, ATR, Trailing Stop, and PSAR.
In addition to the Super Trend indicator, it would be more efficient to prefer indicators that we can add different things. For example, Momentum indicators can contribute in a different sense with their features that are different from Super Trend. For example, Stochastic, RSI, CCI, and TD Sequential can be used together. TD Sequential works very well with the Super Trend indicator.
In fact, Super Trend is a compatible indicator that can be used with all indicators. It can also be used in conjunction with Trend Indicators, Moving Averages, and Fibonacci Plotting Tools.
Each of these indicators can provide valuable information about the market. In addition, the use of SuperTrend in combination with other indicators will help to strengthen Super Trend by helping to reduce false signals in a sideways market. It can also give you a better idea of when to enter and exit trades.
TradingView: https://www.tradingview.com/script/r6dAP7yi/


