TDS: TD Sequential Indicator
What is the TD Sequential Indicator?
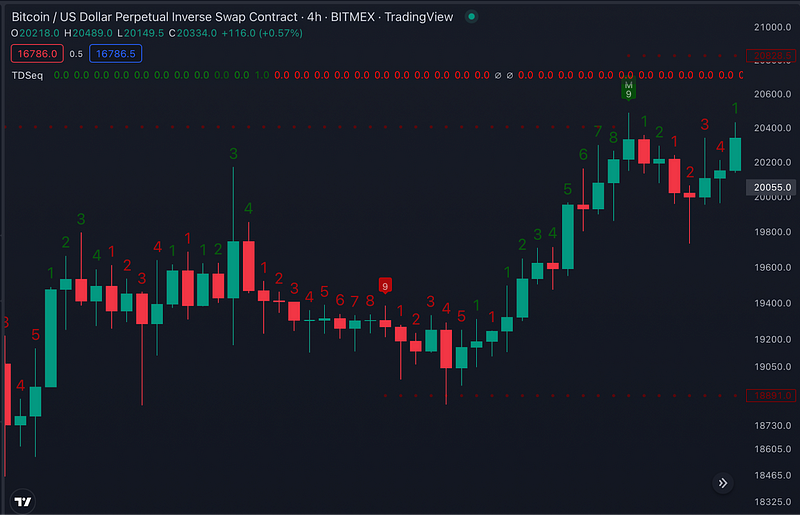
The TD Sequential indicator is also used to generate trading signals based on the formation of TD Sequential sell set-ups and TD Sequential buy set-ups. These set-ups are displayed as green and red dots respectively, and they are used to alert traders of potential trend changes.
It is important to note that the TD Sequential indicator should not be used as the sole tool for making investment decisions. It is recommended to use it in combination with other technical analysis tools and fundamental analysis for a more comprehensive approach.
How to Use TD Sequential?

The TD Sequential indicator is a comprehensive trading tool that can be utilized to determine trend direction, trend progression, and trend changes. It is designed to identify crucial support and resistance levels in the market and to detect potential trend reversals in overbought or oversold market conditions. The indicator uses price data to analyze the momentum and trend in the market.
The TD Sequential indicator can be applied to various market scenarios, including trending and sideways markets, and is known for being more responsive to price movements compared to traditional momentum indicators. It is commonly used to generate successive buy and sell signals, making it an effective tool for traders looking to initiate buy trades.
The indicator signals a saturation level in buying when consecutive green candles, referred to as “buy setups,” are displayed on the chart. On the other hand, consecutive red candles, known as “sell setups,” indicate a saturation level in selling and suggest that it may be time to start buying. To effectively utilize the TD Sequential indicator, it is important to follow the completed 9s and preceding 4 candles to determine the support and resistance levels.
TDS Support and Resistance Levels
The support level on the TDS indicator is the low on a completed sell setup. This level is considered as the floor of a possible sideways price range. If the price action fails to break this level, there is not enough momentum to start a trend. A possible sideways market may occur.
TDS support levels are also useful when a buy setup is completed. If the last candle is close to the support level when the setup is completed and 9 is achieved, it may be a favorable point to buy.
If there is a close below support during or after the buy signal, the level will be canceled. This is interpreted as a continuation of the downward move and stops when the level is broken.
Resistance levels are the highest level in a completed buy setup. This level is treated as the ceiling of a possible sideways price range. If the price action fails to break this level, there is not enough momentum to start a trend. A possible sideways market may form. When the buy setup ends at 9, it can also be considered as a possible first reaction level.
TDS resistance levels also work when a sell setup is completed. If the last candle is close to the resistance level when the setup is completed and 9 is achieved, it may be a suitable point to sell.
TDS at Traderlands Strategy Creator Tool
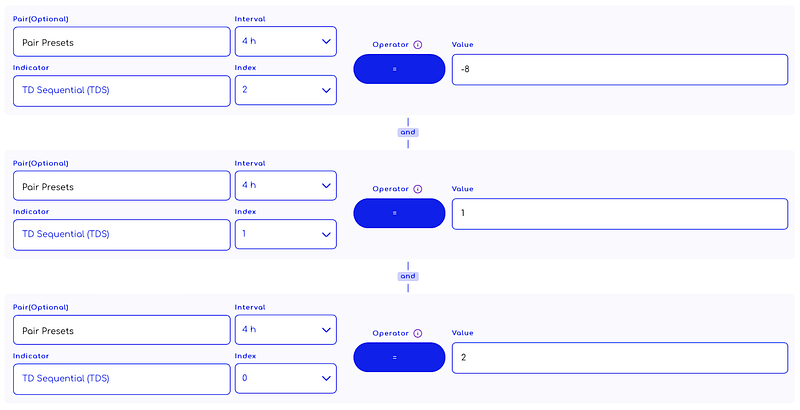
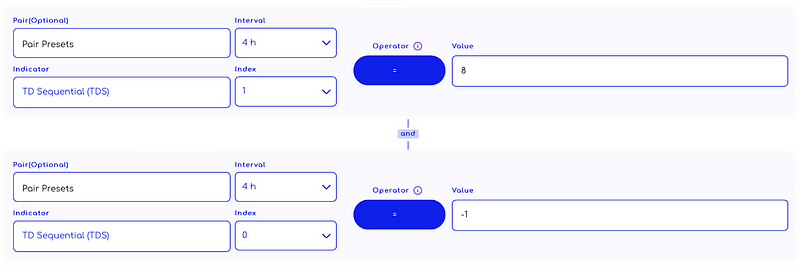
You can start creating a strategy by selecting the “TD Sequential (TDS)” indicator from the list. An example strategy is shown in the image below. You can use the TDS indicator to create a strategy after doing your own research.
Enter Algorithm Rules You Can Add To Strategy Creator

Exit Algorithm Rules You Can Add To Strategy Creator

WARNING: The entry and exit strategies in the images are prepared ONLY for educational purposes to explain how indicators work. It does not guarantee any profit.
When creating an algorithmic trading strategy, a rule set is usually created by using more than one indicator.
Other Indicators can be used with the TD Sequential
TD Sequential indicator is a valuable tool for day traders and can be used in conjunction with other technical indicators to generate trading signals.
The Relative Strength Index (RSI) is a momentum oscillator that measures the speed and change of price movements.
The RSI ranges from 0 to 100 and is considered overbought when it is above 70, and oversold when it is below 30.
The Stochastic Oscillator is another momentum oscillator that measures the relationship between the current closing price and the high/low range over a specific period of time.


