TII: Trend Intensity Index Indicator
The Trend Intensity Index (TII) indicator is a technical analysis tool that measures the strength of a price trend.
The TII indicator is calculated using the sum of positive and negative price changes over a certain period of time, divided by the sum of all price changes over the same period.
A high TII reading indicates a strong trend, while a low TII reading indicates a weak trend. The TII indicator can be used to identify both bullish and bearish trends.
A bullish trend is characterized by higher highs and higher lows, while a bearish trend is characterized by lower highs and lower lows.
The TII indicator can be used in conjunction with other technical indicators to confirm price movements and make more informed trading decisions.
How to use Trend Intensity Index (TII) Indicator?
The Trend Intensity Index (TII) Indicator is a technical tool that can be used to identify the strength of a price trend. The TII is based on the premise that trends tend to persist and that the longer a trend persists, the more likely it is to continue.
The TII indicator measures the intensity of a price trend by looking at the difference between the current price and the price n periods ago. This information is then plotted as a line on a chart with values ranging from 0 to 100.
When the TII indicator is below 20, this typically indicates that prices are range-bound and not trending. If the TII indicator moves above 20 and begins to trend upward, this suggests that prices are beginning to move in an upward direction.
As prices continue to move higher, the TII indicator will move closer to 100, indicating that the uptrend is gaining strength.
Similarly, if prices begin to fall and the TII indicator moves below 20 and starts trending downwards, this suggests that prices are in a downtrend. As prices continue to decline, the TII indicator will move closer to 0, indicating that the downtrend is gaining strength.
The Trend Intensity Index can be used as either a leading or lagging indicator. When used as a leading indicator, traders can look for situations where the TII moves above 20 from below and use this as a signal to enter into long positions.
Alternatively, when used as a lagging indicator, traders can wait for the TII to move below 20 from above and use this as a signal to enter into short positions.
Support and Resistance Levels for Trend Intensity Index (TII)

The Trend Intensity Index (TII) indicator measures the strength of a price trend using a scale of 0 to 100. The TII indicator can be used to identify market tops and bottoms, as well as potential reversals in the direction of the trend.
The following are key support and resistance levels for the Trend Intensity Index (TII) indicator:
50 — This level represents neutral territory for the TII indicator. A move below 50 indicates that downside momentum is increasing, while a move above 50 indicates that upside momentum is increasing.
25 — This level represents strong support for prices, as downside momentum is considered to be very weak when prices are trading near this level. A break below 25 would signal a change in trend from up to down.
75 — This level represents strong resistance for prices, as upside momentum is considered to be very weak when prices are trading near this level. A break above 75 would signal a change in trend from down to up.
How to create a trading strategy with TII
The TII indicator can be used to generate trading signals, identify overbought and oversold market conditions, and find potential turning points in the market.
There are two main ways to use the Trend Intensity Index: as a standalone indicator or as part of a trading strategy.
As a standalone indicator, the Trend Intensity Index can be used to quickly identify strong trends in the market.
The TII indicator will move into overbought territory when prices are trending higher and move into oversold territory when prices are trending lower. These extreme readings can be used to generate buy and sell signals.
When using the Trend Intensity Index as part of a trading strategy, it is common to combine it with other technical indicators.
For example, many traders will use the TII indicator with moving averages or support and resistance levels. By looking for divergence between the TII indicator and price action, traders can spot potential reversals in the market.
Trend Intensity Index (TII) at Traderlands Strategy Creator Tool
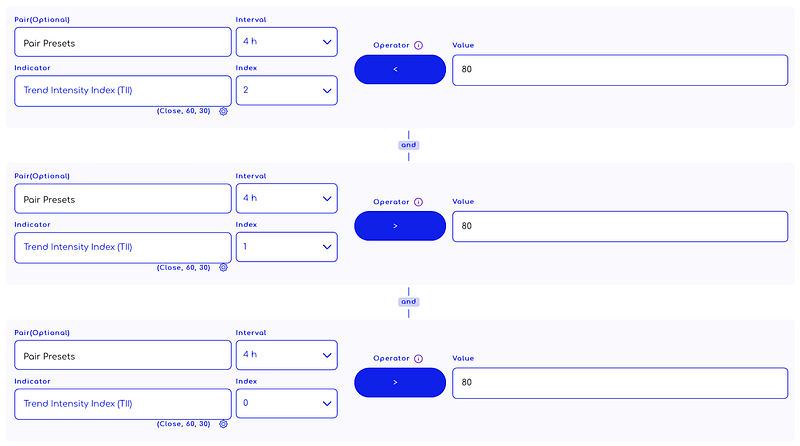
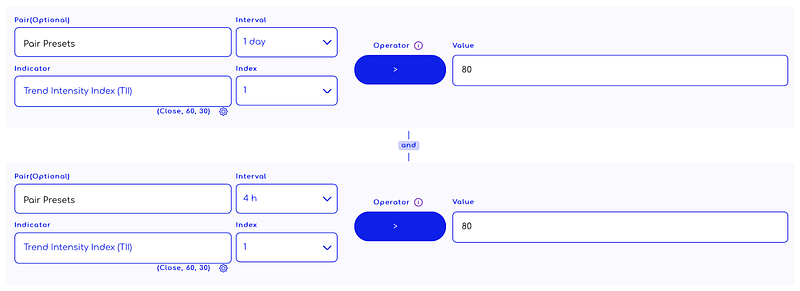
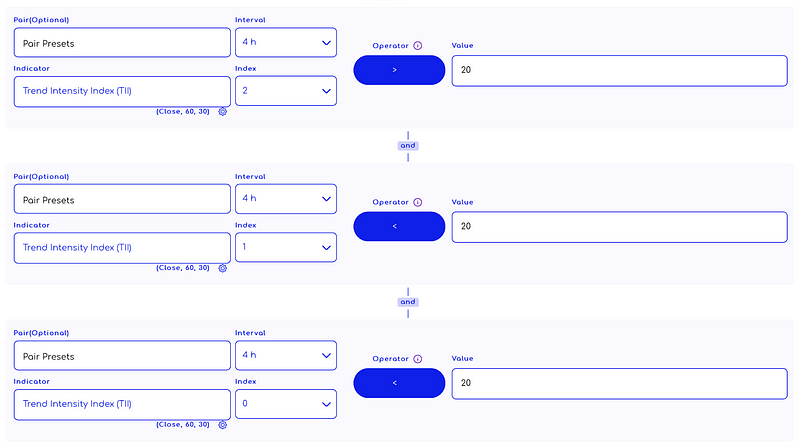
You can start creating a strategy by selecting the “Trend Intensity Index (TII)” indicator from the list. An example strategy is shown in the image below. You can use the Trend Intensity Index (TII) indicator to create a strategy after doing your own research.
Enter Algorithm Rules You Can Add To Strategy Creator
1-Crossover
2. Pair Trend
Exit Algorithm Rules Example
1-Crossunder
2-Pair Trend
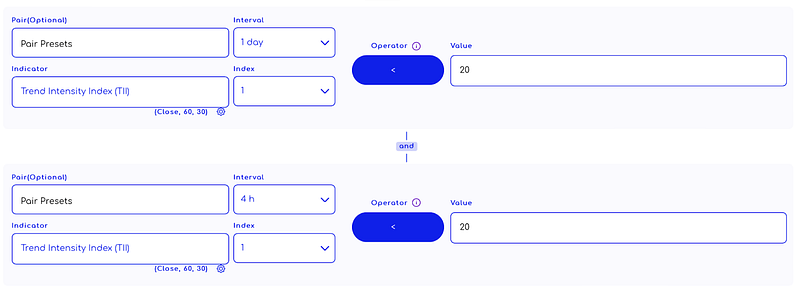
WARNING: The entry and exit algorithms in the images are prepared ONLY for educational purposes to explain how indicators work. It does not guarantee any profit.
When creating an algorithmic trading strategy, a rule set is usually created by using more than one indicator.
Other Indicators can be used with the Trend Intensity Index (TII)
While the Trend Intensity Index is a powerful tool for analyzing price trends, it is not the only indicator that can be used in conjunction with the TII.
Other indicators that can be used to complement the TII include support and resistance levels, moving averages, and momentum indicators.
When using the TII in conjunction with other indicators, it is important to remember that the TII should not be used as a standalone indicator.
Rather, it should be used in combination with other technical indicators to provide a more complete picture of market conditions.


