Wave Trend with Crosses Indicator
What is a Wave Trend with Crosses?
In the realm of technical analysis, detecting potential reversal levels in the cryptocurrency market is crucial for traders and investors. The momentum-based tool that helps identify these critical points is the WaveTrend Indicator.
The WaveTrend Indicator is designed around the concept of wave trends, capturing the underlying momentum in price movements. This indicator uses a combination of Exponential Moving Averages (EMAs), and Simple Moving Averages (SMAs) to determine potential market reversals. By identifying overbought and oversold levels, the WaveTrend Indicator can provide essential trading ideas for traders looking to capitalize on market fluctuations.
WaveTrend Indicator comprises several crucial components, including input parameters, price calculations, WaveTrend calculations, and plotting the indicator.
Plotting the indicator: The code plots overbought and oversold levels, WaveTrend components (Wave Trend 1 and Wave Trend 2), and the area between them. Additionally, it marks crosses between WT1 and WT2 with circles, where the circle’s color indicates the direction of the cross (red for bearish and green for bullish). The background color of the bars also changes based on the cross direction (aqua for bullish and yellow for bearish).
Wave Trend with Crosses Parameters
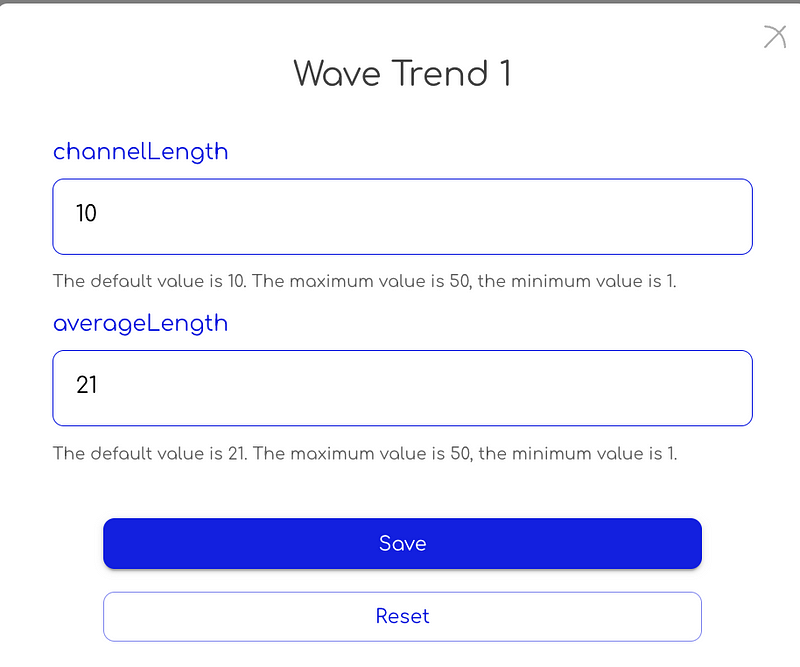
Channel length: This refers to the number of periods used for calculating the upper and lower channels around the moving average. These channels help identify overbought and oversold conditions in the market, which could signal potential reversals. To calculate the channels, you would find the highest high and the lowest low of the oscillator values within the specified channel length and then plot these levels around the moving average.
Default Value is 10 for Channel Length, however, it can be customized between 1–50.
Average Length: This is the period used for calculating the moving average of the oscillator values, which helps to smooth out the oscillator’s fluctuations and provides a clearer view of the overall trend.
A shorter average length will result in a less smooth WaveTrend Indicator, making it more susceptible to short-term price movements and increasing the likelihood of false signals. On the other hand, a longer average length will produce a smoother indicator, reducing sensitivity to short-term price fluctuations and potentially generating more reliable trading signals.
Default Value is 21 for Average Length, however, it can be customized between 1–50.
How to use the Wave Trend with Crosses Indicator?
To develop effective trading strategies using the WaveTrend Indicator, traders can follow these steps:
Identify overbought and oversold levels: When the WaveTrend reaches the overbought or oversold levels, it could indicate a potential reversal. For instance, if the indicator reaches the overbought level and then starts to decline, it might signal a potential top and a bearish reversal.
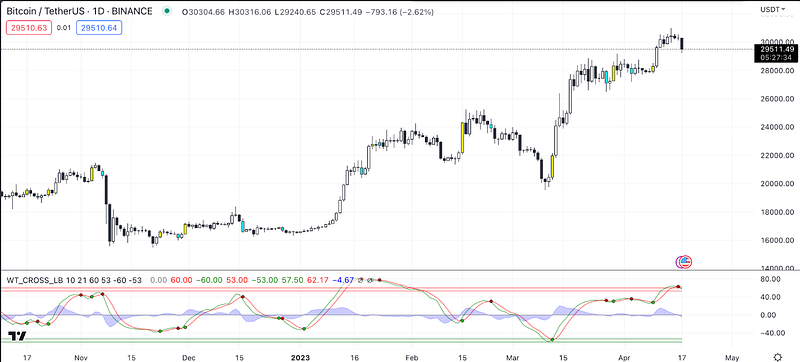
Look for crosses between Wave Trend 1 and Wave Trend 2: A cross between wt1 and wt2 can be used as a trading signal. A bullish signal is generated when wt1 crosses above wt2, and a bearish signal is generated when wt1 crosses below wt2. These crosses can be used as entry or exit points for a trade.
Overbought and Oversold Levels:
The Wave Trend lines indicate overbought and oversold conditions in the market. When Wave Trend Line 1 reaches 60 and Line 2 reaches 53, the market is considered overbought, suggesting that an asset may be overvalued and due for a price correction. Conversely, when Wave Trend Line 1 drops to -60 and Line 2 descends to -53, the market is deemed oversold, implying that the asset might be undervalued and poised for a price increase.
When the wave trendline difference is greater than 0 corresponds to the Wave Trend 1 crossing up Wave Trend 2 line and it is the price action where traders are looking for long opportunities.
When it is lower than 0, Wave Trend line 1 crosses down the Wave Trend line 2 where traders look for short opportunities.
Long Entry Examples:
Consider a long entry when the Wave Trend line 1 (WT) appears to cross above Wave Trend line 2. A bullish trend might be indicated if the WT line shifts into positive territory (above the zero line).
When the wave trendline difference is greater than 0 corresponds to the Wave Trend line 1 crossing up Wave Trend 2 line and it is the price action where traders are looking for long opportunities.
Short Entry Examples:
Think about a short entry when the Wave Trend line 2 (WT2) seems to cross below Wave Trend line 1. A bearish trend could be suggested if the WT line transitions into negative territory (below the zero line).
Using as an Exit Indicator Examples:
For long positions, consider exiting when the WT line enters negative territory.
For short positions, think about exiting when the WT advances into positive territory.
Wave Trend with Crosses Return Values

Wave Trend 1 Value: Represents the value of the green line in the chart.
Wave Trend 2 Value: Represents the value of the red line in the chart.
Wave Trend Difference: Indicates the value of the difference between the two lines (Wave Trend 1 — Wave Trend 2).
Wave Trend with Crosses Indicator at Traderlands Strategy Creator Tool
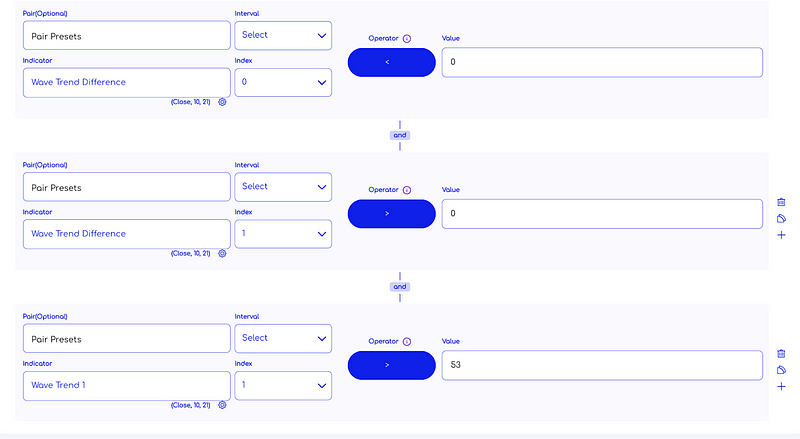
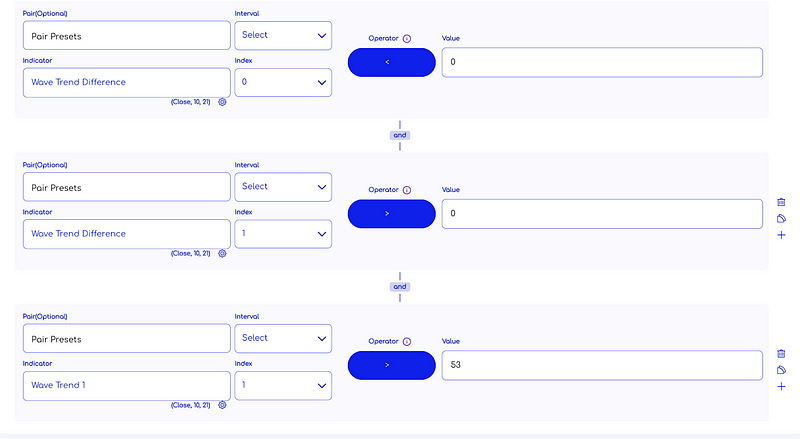
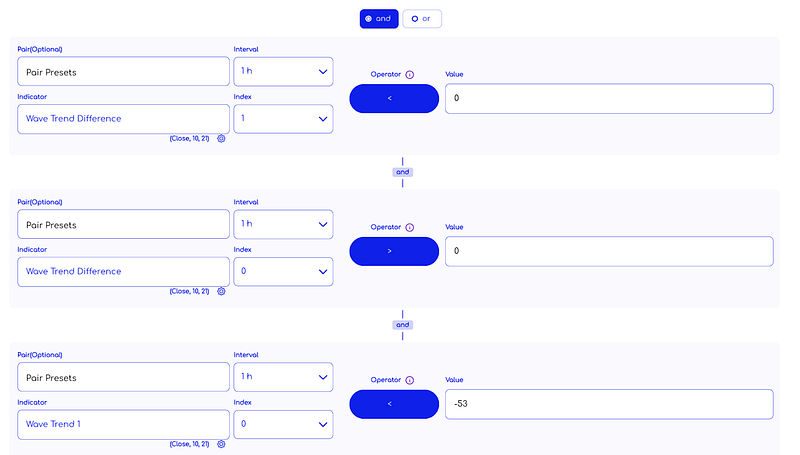
You can start creating a strategy by selecting “Wave Trend 1”, “Wave Trend 2” and “Wave Trend Difference” from the list. An example strategy is shown in the image below. You can use the Wave Trend with Crosses indicator to create a strategy after doing your own research.
Enter Algorithm Rules You Can Add To Strategy Creator For Long Strategy
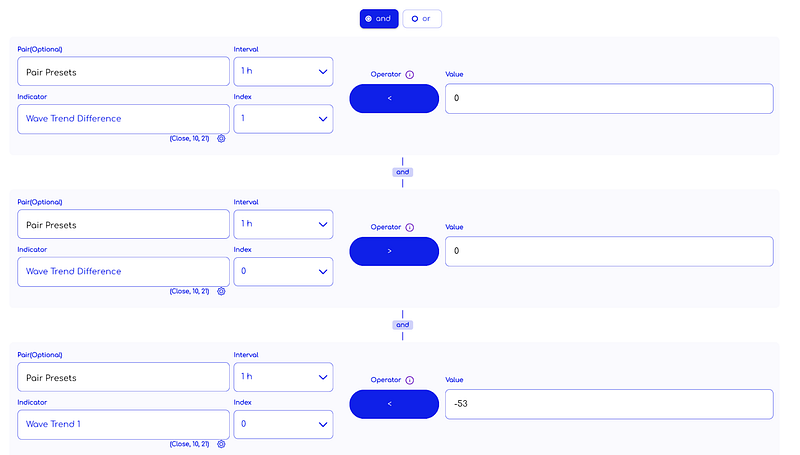
Exit Algorithm Rules You Can Add To Strategy Creator For Long Strategy
Enter Algorithm Rules You Can Add To Strategy Creator For Short Strategy
Exit Algorithm Rules You Can Add To Strategy Creator For Short Strategy
WARNING: The entry and exit strategies in the images are prepared ONLY for educational purposes to explain how indicators work. It does not guarantee any profit.
When creating an algorithmic trading strategy, a rule set is usually created by using more than one indicator.
TradingView: https://www.tradingview.com/v/jFQn4jYZ/


