Williams %R and Algorithmic Trading
When it comes to algorithmic trading, Williams %R is a well-known technical indicator. But what is it and how can it be used in trading?
In this blog post, we will explore Williams %R and how it could be used in trading in 2023.
What is a Williams %R Indicator?
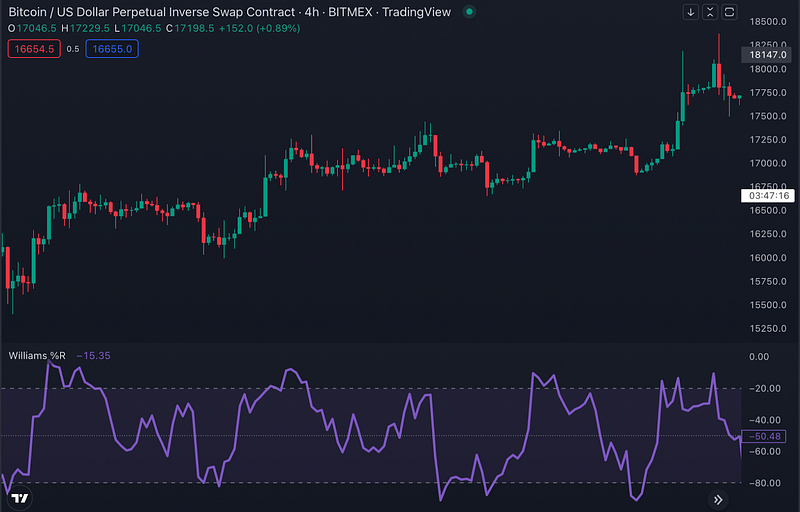
The Williams %R indicator is a momentum oscillator that measures overbought and oversold levels in the market.
The indicator ranges from 0 to -100, with readings above -80 considered overbought and readings below -20 considered oversold.
The Williams %R indicator is used by traders to identify potential reversals in the market. The indicator can also be used to find trending markets.
When the Williams %R is below -50, it indicates that the market is in an uptrend. When the Williams %R is above -50, it indicates that the market is in a downtrend.

How to use Williams %R Indicator
Williams %R is a technical indicator that measures overbought and oversold levels in the market. It is calculated using the following formula:
%R = (Highest High — Close)/(Highest High — Lowest Low) x -100
The resulting value is then plotted on a scale from 0 to -100, with readings below -80 considered oversold and readings above -20 considered overbought.
Williams %R can be used in conjunction with other technical indicators to generate buy and sell signals.
For example, if Williams %R is below -80 and then crosses above -50, this could be interpreted as a buy signal. Conversely, if Williams %R is above -20 and then crosses below -50, this could be interpreted as a sell signal.
It’s important to note that Williams %R is a lagging indicator, so it’s best used in conjunction with other technical indicators or price patterns for trade confirmation.
Support and Resistance Levels for Williams %R Indicator
When it comes to trading stocks, one of the most important concepts to understand is support and resistance.
Simply put, support is the level at which demand for security is thought to be strong enough to prevent the price from falling further. Resistance, on the other hand, is the level at which supply is thought to be strong enough to prevent the price from rising further.
The Williams %R indicator is a technical analysis tool that can be used to identify potential support and resistance levels. The Williams %R is calculated using the following formula:
(Highest High — Close) / (Highest High — Lowest Low) x -100
The Williams %R can be used on any time frame, but it is most commonly used on daily or weekly charts. When using this indicator, traders will typically look for divergences between the indicator and price action as potential trade signals.
For example, if the price of a stock is making new highs but the Williams %R is failing to do so, this could be indicative of an impending reversal lower.
How to create a trading strategy with a Williams %R Indicator
The Williams %R is a momentum indicator that measures overbought and oversold levels in the market. It is a valuable tool for traders to use in order to create trading strategies.
There are a few steps that need to be followed to create a trading strategy with a Williams %R Indicator. First, the trader needs to identify the market trend.
Second, the trader needs to identify overbought and oversold levels using the Williams %R Indicator. Finally, the trader needs to create a trading strategy that takes into account these levels.
The Williams %R Indicator can be used in conjunction with other technical indicators and tools, such as support and resistance levels, Fibonacci levels, and moving averages.
By taking all of these factors into account, traders can develop robust trading strategies that can be used in any market condition.
Williams %R Indicator at Traderlands Strategy Creator Tool
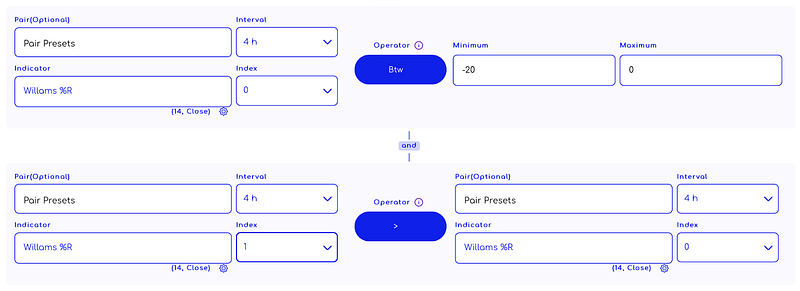
You can start creating a strategy by selecting the “Williams %R” indicator from the list. An example strategy is shown in the image below. You can use the Williams Percent R indicator to create a strategy after doing your own research.
Enter Algorithm Rules You Can Add To Strategy Creator

Exit Algorithm Rules You Can Add To Strategy Creator

WARNING: The entry and exit strategies in the images are prepared ONLY for educational purposes to explain how indicators work. It does not guarantee any profit.
When creating an algorithmic trading strategy, a rule set is usually created by using more than one indicator.
Other Indicators can be used with the Williams %R Indicator
The Williams %R indicator is just one of many technical indicators that can be used to help make trading decisions.
Some other popular indicators include Moving Averages, Bollinger Bands, and the MACD. Each indicator has its strengths and weaknesses, so it’s important to pick the right indicator (or combination of indicators) for the job.
For example, moving averages are great for identifying trends, but they don’t do a good job of identifying reversals.
Bollinger Bands can help with both trend identification and reversal detection, but they tend to be more accurate in choppier markets.
The MACD is another versatile indicator that can be used for trend following or reversal trading.
Ultimately, it’s up to the trader to experiment with different indicators and find which ones work best for their own trading style and market conditions.


